

Developing new ways to visualize information has been one of the most active areas in the digital humanities.
We have already commented, here on the blog, on the techniques for textual representation in word clouds. But among the projects aimed at manipulating historical, spatial and textual data, the ones that make use of graph-based tools for network visualization stand out.
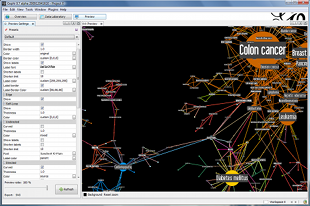
- Visualization model by algorithm
- Multi-algorithm visualization model in Gephi (more models at https://gephi.org/features)
More models at gephi.org/features
The most widely used tool for graph manipulation has been Gephi, a free collaborative software maintained by a consortium based in France, with numerous applications in areas such as biological sciences or economics – here we comment on its use in projects related to history and textual analysis.
One of the first projects to make use of Gephi for historical data is Mapping the Republic of Letters, based at Stanford University.
The project, which is dedicated to studying the formation of the correspondence network between literates in the 17th and 18th centuries, created the Electronic Enlightenment database, consisting of thousands of letters (in fact, 55,000 letters involving 6,400 correspondents); in 2009, in collaboration with computer scientists, a platform was launched for visualizing the network formed by the exchange of this correspondence, using Gephi.
As D. Chang and colleagues point out in the article Visualizing the Republic of Letters, the manipulation of data for its visual representation founded on graphs involves important methodological and epistemological questions – among which would be the question about its impacts on the interpretive perspective of human scientists themselves. How will these academics, trained and experienced in the vertical and in-depth reading of isolated documents, make sense of the patterns formed by the junction, in a network, of large data sets? – Or, in the authors’ words, “How can humanities scholars trained in close reading of individual documents make sense of patterns in large sets of data?”
A question that can be taken as the reverse of this one is the one that guides some of the research conducted by the Laboratory for Studies on Image and Cyberculture (Labic) dedicated to understanding the meanings that are formed by the remissive relationship between the small texts that circulate today in the so-called social networks.
Also through visualization in Gephi, some of the social network “cartographies” carried out in the lab have shown how networks are formed around some main “nodes” that propose, disseminate and shape the circulation of meanings – in particular, in the case of texts published on Twitter around political issues and figures (see, for example, Dilma on social networks: the end of political bipolarity and the desire to radicalize change). The studies on social networks conducted in this laboratory, active since 2008 at the Federal University of Espírito Santo, are an example of an increasingly intense line of studies around the world on the circulation of meanings in social networks (especially in the field of politics), many of them making use of graph data visualization tools (see an extensive list in the Gephi’s wiki).
In the field of textual studies more generally, graph visualization techniques have been applied mainly in studies dealing with large volumes of texts – for a very interesting example, see the article Identifying the Pathways for Meaning Circulation using Text Network Analysis, by Dmitry Paranyushkin.
Graph of a text network in “Identifying the Pathways for Meaning Circulation using Text Network Analysis”, by Dmitry Paranyushkin
Again, the question of the calibration of the gaze arises: the step between the (let’s say) finer perspective by which philologists, linguists and literary critics have become accustomed to reading the text, and the (let’s try again) amplified perspective by which we can now analyze large sets of texts (in fact: by which we can visualize relations between texts in large sets) – is it a step that will determine a new reading? We have dealt with it other times in this blog, in this post, and especially in this one; there is also a very interesting discussion on the subject in The Dragonfly’s Gaze blog: Computational approaches to literary text analysis.
For many, the use of new techniques to manipulate and present large volumes of data leads to new possibilities for analysis – for to build a representation, naturally, is to propose an interpretation. Thus, projects in this area are a striking example of the complexity involved in the relationship between digital technologies and the humanities: computational technologies are at the same time “useful tools” in the construction of knowledge and determinants of knowledge construction.